Screenshots
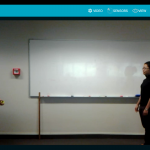
- Record a video for the camera experiment.
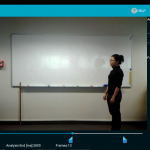
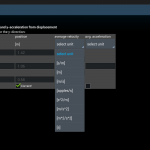
- Motion analysis settings screen.
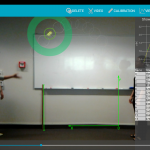
- Tagging the moving ball and visualising the physics model instantly.
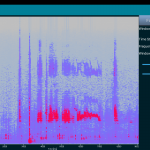
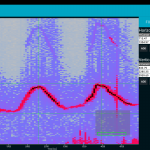
- Frequency analysis of a recorded audio file.
- Horizontal and vertical cursors can be used to mark interesting points in the frequency map. For example, the amplitude and period of a periodic signal.
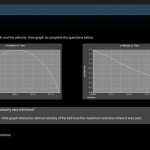
- Discussion questions in a lab activity.
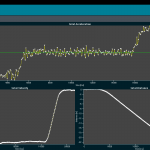
- Accelerometer data taken in an elevator going downwards.
- Example of a Lab Activity sheet containing some sub components such as text and check boxes.
- Lab activity sheet for velocity and acceleration calculations.
- View component to estimate the energy input.
Motion Analysis (Lablet 1.0)
An old demo video for the first Lablet version 1.0 (previously named Physics Tracker):
