The frequency analysis displays the result of a Fourier analysis in a 2D graph. The graph can be zoomed and moved.
There are various settings for the Fourier analysis.
- Window Size: To adjust the length of the data window for the Fourier analysis.
- Window Overlap: The overlap between two consecutive windows of the Fourier analysis.
- Contrast/Brightness: To optionally improve the visualisation of the Fourier data.
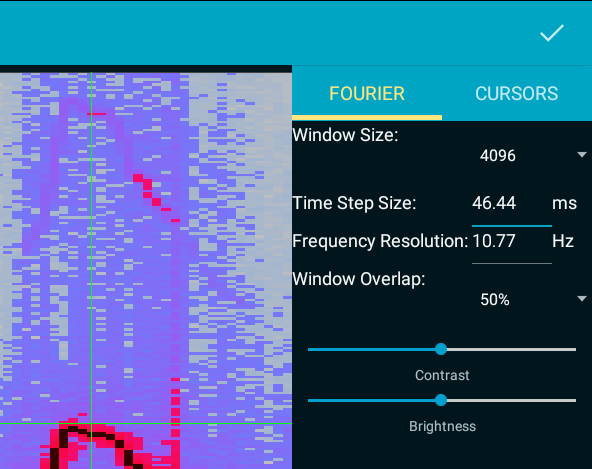
Parameters for the Fourier analysis.
Cursors
To mark a point of interest in the frequency map, horizontal and vertical cursors can be used. To do so, first activate the cursor tab on the right side of the screen. On this tab, cursors can be added or removed. To position a cursor, just drag them on the frequency map.
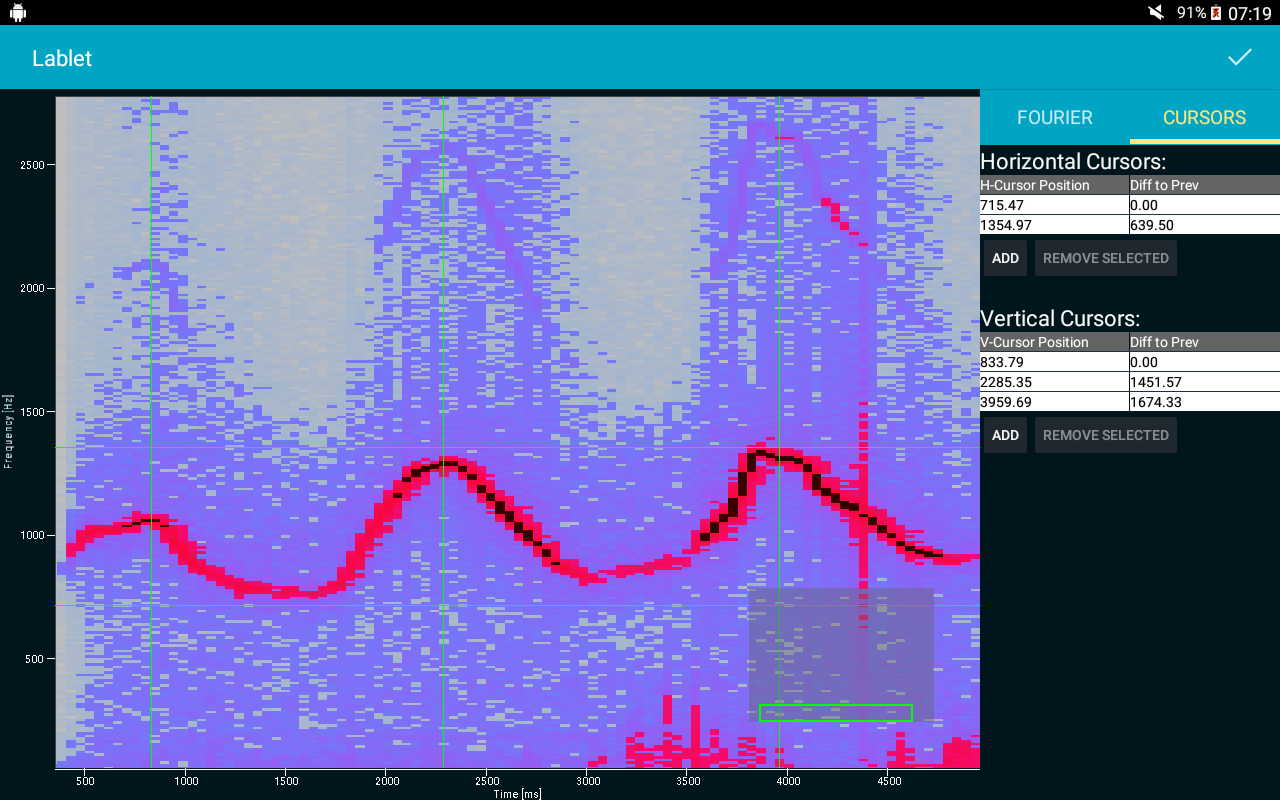
Horizontal and vertical cursors can be used to mark interesting points in the frequency map. For example, the amplitude and period of a periodic signal.